


Labour market indicators are vital signs of an economy’s health, revealing crucial insights about employment trends, workforce participation, and economic growth potential. Economists, policymakers, and business leaders rely heavily on these metrics to make informed decisions about monetary policy, business expansion, and social welfare programmes.
Understanding key indicators like unemployment rates and job vacancies requires careful analysis, as each metric offers a different perspective on labour market conditions. The Australian economy, for example, uses a comprehensive set of market indicators to track employment patterns. Furthermore, leading indicators such as job advertisements provide valuable forecasting capabilities, helping analysts predict future labour market movements before they occur. Labour market analysis has evolved significantly, particularly with the development of composite indicators that combine multiple data sources to deliver clearer economic signals.
This article explores the fundamental concepts behind labour market measurements, examines their limitations, and demonstrates how advanced indicator models can enhance economic forecasting accuracy. Readers will gain insights into both basic metrics and sophisticated analytical techniques used by central banks and economic institutions worldwide.
Understanding Labour Market Indicators and Their Role

The labour market serves as a crucial economic mechanism where the exchange of human resources occurs, impacting everything from national productivity to individual livelihoods. Understanding these dynamics requires careful analysis of specialised indicators that reveal deeper economic patterns and trends.
What is a Labour Market?
The labour market represents a structured environment where workers (employees) and employers interact regarding jobs, working conditions, and wages. Essentially, it functions as the meeting point within an economy where people selling their labour negotiate with those buying it. This interaction creates the framework through which vital economic activities are coordinated and labour resources allocated.
Unlike other markets, the labour market involves complex human elements—skills, education, geographical constraints, and social factors all influence how effectively it functions. Moreover, the market encompasses various issues, including employment rates, unemployment figures, participation rates, and wage structures.
The labour market’s significance extends beyond simple employment statistics. It represents a significant component of any economy and maintains intricate links to markets for capital, goods, and services. When functioning efficiently, it allocates human resources effectively, maximising productivity and supporting economic growth. Consequently, disruptions in the labour market can ripple throughout the entire economy, affecting consumer spending, business investment, and overall economic stability.
Labour markets provide valuable insights at both macroeconomic and microeconomic levels:
- Macroeconomic view: Reveals broader economic patterns through unemployment rates, productivity measurements, and participation rates
- Microeconomic view: Offers insights into individual wages, working hours, and employment conditions
Both perspectives inform government policies and business decisions regarding employment. Additionally, labour market health directly influences consumer confidence and spending patterns, which subsequently impact business investment decisions.
How Indicators Inform Economic Policy and Forecasting?
Labour market indicators serve as critical tools for policymakers, economists, and business leaders in assessing economic conditions and making informed decisions. The unemployment rate, most commonly used to measure labour market slack, helps gauge available capacity within the economy. A shortage of qualified workers may lead to inflation and wage pressure when unemployment gets closer to the non-accelerating inflation rate of unemployment.
Central banks monitor numerous indicators when forming monetary policy decisions. The unemployment rate plays a particularly significant role as it relates directly to the RBA’s dual mandate—addressing both full employment and inflation targets. Unemployment forecasts serve as essential inputs into inflation projections, creating a direct link between labour market conditions and monetary policy decisions.
Beyond the headline unemployment figure, policymakers analyse various other indicators that often signal changes in labour market conditions before they become apparent in unemployment statistics. These include:
- Job advertisements and vacancies capture unmet demand for labour
- Consumer expectations regarding future unemployment trends
- Business hiring intentions from surveys and liaison programmes
Labour market forecasts fulfil two primary functions—guiding government policy decisions and providing information to individual market participants. Nevertheless, no single indicator offers a complete picture, which is why many institutions develop composite indicators that combine multiple metrics for a more comprehensive assessment.
Labour market indicators also help identify structural issues requiring policy intervention. When analysed properly, these metrics assist in anticipating changing skill needs, potential labour shortages, and emerging workforce trends. The ability to forecast such developments enables more effective planning for education, training, and economic development initiatives.
Key Labour Market Metrics Used in Australia
Australia’s economic policymakers rely on several crucial metrics to gauge labour market health. These indicators provide vital information about workforce dynamics, though each offers different insights and carries specific limitations.
Unemployment Rate and Limitations
The unemployment rate stands as the most commonly referenced labour market metric, measuring the percentage of people in the labour force without work. In Australia, a person is considered unemployed if they are not in paid employment, are actively seeking work, and are available to start within four weeks. As of June 2025, Australia’s unemployment rate reached 4.2% in trend terms and 4.3% in seasonally adjusted terms.
Despite its prominence, the unemployment rate presents several notable limitations:
- It excludes discouraged workers who have stopped looking for employment
- It counts someone working just one hour weekly as employed
- It fails to reflect the quality or stability of employment
- It doesn’t account for those wanting to work more hours
Research indicates that if discouraged workers and others wanting work but not classified as unemployed were included, the official unemployment figure would more than triple. Indeed, according to recent data, 1.7 million Australians were not working but wanted to work in February 2025, revealing a significant gap between official statistics and actual labour market slack.
Participation Rate and Employment-to-Population Ratio
The participation rate represents the percentage of working-age Australians either employed or actively seeking work. This metric reached 67.1% in June 2025 (seasonally adjusted), notably higher than the historical average of 63.66% recorded from 1978 to 2025.
Meanwhile, the employment-to-population ratio measures employed people as a proportion of the working-age population. This ratio reached 64.2% in June 2025, reflecting a record high.
Both indicators respond to business cycles. During economic expansions, businesses hire more workers and offer higher wages, increasing incentives to seek employment. Conversely, during downturns, reduced hiring and smaller wage increases diminish these incentives. Structural factors besides economic cycles—including more part-time opportunities, increased female participation, and delayed retirement—have similarly influenced these rates over time.
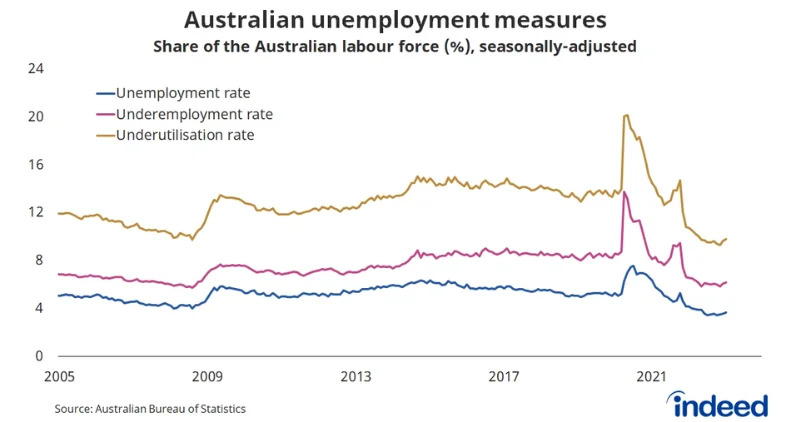
Underemployment and Underutilisation Rates
Underemployment occurs when employed individuals want and are available to work additional hours. According to the Australian Bureau of Statistics, underemployed workers include part-time employees seeking more hours and full-time workers temporarily working part-time hours due to economic reasons. The underemployment rate remained at 5.9% in trend terms and increased to 6.0% in seasonally adjusted terms in June 2025.
Of the 14.7 million employed Australians in May 2025, approximately 1.3 million preferred and were available to work more hours. Underemployment disproportionately affects certain demographic groups, especially younger workers and those in industries with high part-time employment shares.
The labour force underutilisation rate combines unemployment and underemployment figures to provide a broader assessment of unused labour capacity. This metric helps economists identify spare capacity that could be tapped before wage pressures emerge. The extended labour force underutilisation rate further expands this concept by including marginally attached workers—those who want work but aren’t actively seeking it or aren’t immediately available.
Throughout economic analysis, these metrics collectively offer a multidimensional view of Australia’s labour market conditions, capturing various aspects of employment, unemployment, and workforce participation.
Leading Indicators and Their Predictive Power

Beyond the standard labour market metrics, forward-looking indicators offer early signals of employment trends. These predictive tools allow policymakers and analysts to anticipate shifts in unemployment before they materialise in official statistics.
Job Vacancies and ANZ–Indeed Job Advertisements
Job vacancies and advertisements reveal firms’ unmet demand for labour, signalling labour market tightness. When labour demand exceeds supply, vacancies typically rise as companies post more positions and face difficulties filling them. This creates a negative correlation between job vacancy and unemployment rates—a relationship economists call the Beveridge Curve.
The Australian Bureau of Statistics (ABS) measures job vacancies quarterly, capturing all positions ready to be filled immediately, open to external applicants, and actively recruited for. As of May 2025, total job vacancies reached 339,400, representing a 2.9% increase from February 2025. Private sector vacancies specifically rose by 3.2% to 301,900.
WMI Unemployment Expectations Index
The Westpac–Melbourne Institute (WMI) unemployment expectations index captures consumer perceptions about future labour market conditions rather than employer hiring decisions. A declining index suggests more consumers anticipate that unemployment will fall over the coming year.
In July 2025, the index rose 1.1% to 128.7, aligning precisely with its long-run average. While consumers weren’t fearful of job losses, this reading suggested a flat rather than strengthening labour market.
NAB and RBA liaison employment intentions
Business surveys from the National Australia Bank (NAB) and the Reserve Bank of Australia’s (RBA) liaison programme offer forward-looking insights into firms’ hiring plans. Strengthening employment intentions potentially signals declining unemployment.
Although previously elevated, job switching intentions had decreased recently and no longer exceeded historical norms. The job-loser unemployment rate stood at 1.4%—historically low but rising from its 2022 trough. While most businesses reported plans to expand headcount, this represented a decline from 2022 peaks.
The strongest correlations between these leading indicators and unemployment rate changes typically occur with a one-quarter lag. For all indicators, the strongest relationship appears between indicator changes from the previous quarter and current unemployment rate movements. These correlations demonstrate the indicators’ value for near-term unemployment forecasts.
Building a Summary Leading Indicator

Individual labour market indicators offer valuable insights yet present an incomplete picture when used in isolation. To address this limitation, economists increasingly rely on composite metrics that combine multiple data points into a single, more reliable measure.
Combining ABS vacancies, ANZ–Indeed ads, and WMI expectations
Creating a practical summary leading indicator requires selecting complementary metrics that collectively capture different aspects of labour market dynamics. A robust approach involves combining three key indicators: ABS job vacancies, ANZ–Indeed job advertisements, and the Westpac-Melbourne Institute (WMI) unemployment expectations index. This particular combination was selected primarily because these series offer the longest historical data, providing crucial context across various economic cycles.
Standardisation and Averaging Methodology
Standardisation becomes essential to creating a meaningful composite indicator from disparate data sources. The preferred method involves converting each component into a z-score format, establishing a mean of zero and a standard deviation of one. This mathematical transformation ensures all variables contribute equally, regardless of their original scale or unit of measurement. Above all, z-scores make fundamentally different metrics directly comparable.
The summary leading indicator is calculated as a simple average of these standardised values: specifically, the percentage changes in vacancies and job advertisements (expressed as ratios to the labour force) and the percentage point change in the unemployment expectations index. Occasionally, different weights might be assigned to reflect the relative importance or statistical adequacy of individual components. In practice, given that a z-score is a numerical measurement describing a value’s relationship to the mean, components with extreme values exert greater influence on the final composite.
Why a Composite Indicator Improves Signal Clarity
Composite indicators excel at measuring multidimensional concepts that cannot be adequately captured by single metrics. A composite approach filters out the statistical noise inherent in individual indicators, which often display month-to-month volatility. In fact, no individual indicator provides a truly holistic view of labour market conditions.
The summary leading indicator has historically co-moved with and led movements in the unemployment rate. Research demonstrates that indicator models using either the summary leading indicator or ANZ–Indeed job advertisements alone significantly outperform benchmark models for forecasting unemployment, at least over the first year. The strongest correlations between these labour market indicators and unemployment rate changes typically occur with a one-quarter lag. To clarify, changes in the indicator from the previous quarter show the strongest relationship with current unemployment rate movements, making them valuable tools for near-term forecasting.
Forecasting Unemployment Using Indicator Models
Evaluating which labour market indicators best predict unemployment requires rigorous testing through statistical models. This analytical process helps economists identify the most reliable signals for policy decisions.
Out-of-sample forecast evaluation method
To assess forecasting capabilities, economists employ out-of-sample evaluation techniques , where models are estimated using a subset of available data and then tested against actual outcomes. This approach effectively replicates real-world forecasting conditions faced by economists. The process typically involves generating forecasts with models estimated on initial data subsets, then progressively adding data quarters until all available information is utilised.
RMSE comparison with benchmark AR(1) models
Root mean squared errors (RMSEs) measure forecast accuracy by capturing differences between predictions and actual outcomes. Lower RMSE values indicate superior forecasting performance. Benchmark models, often autoregressive (AR) specifications, provide comparison standards against which indicator models are judged. Pre-pandemic periods are generally preferred for evaluation to avoid distortions from unusual economic volatility.
Performance of summary vs individual indicators
Among various indicators, the summary leading indicator and ANZ–Indeed job advertisements demonstrate superior performance. These models show statistically significant outperformance over benchmark models—summary indicators excel through six forecast quarters ahead, whilst ANZ-Indeed advertisements maintain advantage for three quarters. Interestingly, models containing employment intentions alone perform only as well as benchmark models, potentially because they primarily capture market sector developments.
Conclusion – Labour Market Indicators
Labour market indicators stand as essential tools for understanding economic health and making informed policy decisions. Throughout this article, we have explored how these metrics serve as economic vital signs, revealing crucial patterns in employment, workforce participation, and growth potential. The unemployment rate, despite its limitations, remains a cornerstone measurement, albeit one that fails to capture discouraged workers or underemployment concerns.
Undoubtedly, labour market analysis continues to evolve as economists develop increasingly sophisticated methods for measuring workforce dynamics. These advancements enable more accurate forecasting, better-informed policy decisions, and clearer insights into economic trends. Future developments will likely focus on refining composite indicators further and incorporating new data sources to enhance predictive power even further.
What are the key indicators used to measure labour market health in Australia?
The main indicators include the unemployment rate, participation rate, employment-to-population ratio, underemployment rate, and labour force underutilisation rate. These metrics collectively provide a comprehensive view of employment trends and workforce participation.
How do leading indicators help forecast unemployment?
Leading indicators like job vacancies, ANZ-Indeed job advertisements, and consumer expectation indices can signal future unemployment trends before they appear in official statistics. They provide valuable early insights, allowing policymakers and economists to anticipate changes in the labour market.
What are the limitations of the unemployment rate as a labour market indicator?
The unemployment rate doesn’t account for discouraged workers who’ve stopped looking for jobs, doesn’t reflect underemployment, and counts someone working just one hour a week as employed. It also fails to capture the quality or stability of employment.